EmbedSOM
EmbedSOM is a fast, precise and flexible way to produce visualizations of high-dimensional datasets; currently used mostly for flow and mass cytometry data. This page mainly collects information about the R EmbedSOM implementation. That is currently available also as a R package EmbedSOM from CRAN.
EmbedSOM is being actively developed, the internals are described in an article in F1000: Kratochvíl M, Koladiya A and Vondrášek J. Generalized EmbedSOM on quadtree-structured self-organizing maps [version 1]. F1000Research 2019, 8:2120 (https://doi.org/10.12688/f1000research.21642.1)
Overview of the functionality and of the tools in the EmbedSOM package is provided in the following vignettes:
- Basic embedding on a toy dataset
- Visualizations of single-cell data using different landmarks, demonstrated on a mass cytometry dataset
- Embedding single-cell data with pseudo-time, using a dataset with many time points
- A mildly amusing demo of embedding prehistoric animal skeletons
(EmbedSOM version at least 2.1 is required for reproducing the later vignettes!)
Download
The source code is hosted on GitHub:
You can install the package into your R library from GitHub using e.g. devtools, or directly from CRAN:
devtools::install_github('exaexa/EmbedSOM')install.packages('EmbedSOM')(may download an outdated version)
Example in R
EmbedSOM can be used to nicely visualize results from FlowSOM analyses. The following example produces a nice image of the Levine-13 dataset:
$ R
> fs <- FlowSOM::ReadInput('Levine_13dim_cleaned.fcs', scale=TRUE, transform=TRUE, toTransform=c(1:13))
> fs <- FlowSOM::BuildSOM(fs, xdim=30, ydim=5, colsToUse=c(1:13)) # compute a wide, asymmetric SOM (for wide pictures)
takes a few seconds...
> e <- EmbedSOM::EmbedSOM(fsom=fs) # compute 2D coordinates of cells
several more seconds...
> par(mfrow=c(2,1))
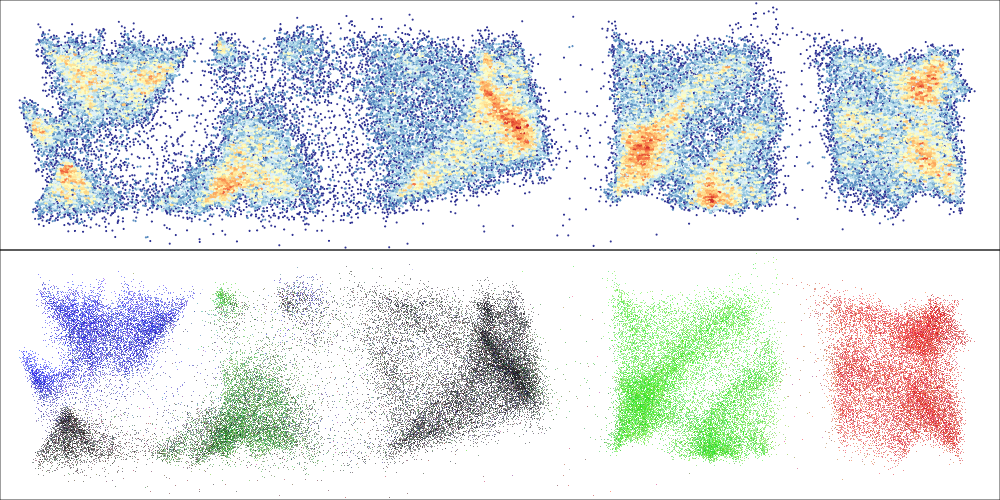
> EmbedSOM::PlotEmbed(e, fsom=fs, pch=20, cex=.4) # convenience wrapper around plot(), this plots cell density
> EmbedSOM::PlotEmbed(e, fsom=fs, red='CD8', green='CD4', blue='CD19') # colorize marker expressions
Result: